
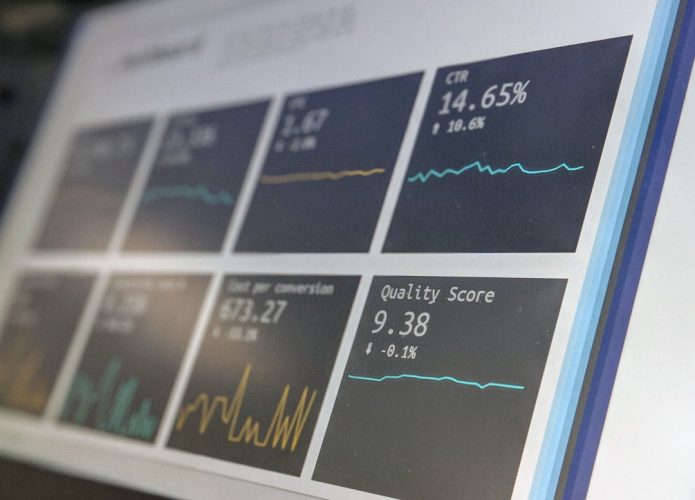
Welcome to the digital age, where your online presence is often the first, and sometimes only, impression you make on potential customers. In this fiercely competitive landscape, a fast, reliable, and user-friendly website isn’t just a luxury – it’s a fundamental pillar of business success. You’ve invested time, money, and effort into crafting your perfect online storefront, but have you considered how it’s actually performing? If not, you’re leaving money on the table and risking customer churn. This comprehensive guide will walk you through the essential practice of website performance monitoring, helping you understand its importance and how to implement it effectively to maximize your business potential.
Before delving into the how-to, it’s crucial that you grasp why website performance matters so profoundly to your business. Think of your website as your digital storefront. Would you ever ignore a crumbling facade, slow service, or constant product unavailability in a physical store? Of course not. The same logic applies, perhaps even more so, to your website.
The Direct Link to User Experience
Your website’s performance directly correlates with the experience your users have. In today’s fast-paced world, patience is a dwindling commodity.
Page Load Speed: The First Impression
You have mere seconds to capture a user’s attention. Research consistently shows that even a one-second delay in page load time can lead to a significant drop in page views, customer satisfaction, and conversions. Users are quick to abandon slow-loading sites, looking for alternatives that offer a smoother, faster experience. This isn’t just about impatience; it’s about perceived professionalism and efficiency. A slow site can inadvertently signal that your business is outdated, unreliable, or simply doesn’t care about its customers’ time.
Responsiveness and Interactivity
Beyond initial load times, how quickly does your site respond to user interactions? Can they click buttons, navigate menus, and complete forms without frustrating delays? A sluggish, unresponsive interface creates friction, making even simple tasks feel onerous. This friction not only irritates users but can also lead them to abandon carts, leave incomplete forms, or simply navigate away in frustration. When your site is fluid and responsive, it creates a positive, effortless user journey.
Mobile Experience: A Non-Negotiable Imperative
With the advent of smartphones, a significant portion of your traffic likely comes from mobile devices. Your website must perform flawlessly on every screen size and network condition. A desktop-optimized site that struggles on mobile will alienate a huge segment of your potential audience. Mobile performance monitoring is paramount to ensure your business remains accessible and competitive in a mobile-first world.
SEO Implications: Visibility and Ranking
Search engines like Google are constantly striving to provide the best possible user experience to their own users. Therefore, website performance is a critical ranking factor.
Core Web Vitals: Google’s Performance Metrics
Google explicitly uses Core Web Vitals (Largest Contentful Paint, First Input Delay, and Cumulative Layout Shift) as metrics to assess user experience and influence search rankings. If your website performs poorly on these metrics, you’re actively hindering your SEO efforts. This means less organic traffic, lower visibility, and ultimately, fewer potential customers discovering your business through search engines. Ignoring these signals is akin to intentionally burying your business beneath your competitors in search results.
Crawl Budget and Indexing
Faster websites allow search engine crawlers to process more pages in a given amount of time, known as your “crawl budget.” If your site is slow, crawlers might spend less time on it, leading to fewer pages being indexed, or slower updates to existing indexed content. This can impact how quickly new products, services, or content updates appear in search results, putting you at a disadvantage.
Bounce Rate and Dwell Time
Although not direct ranking factors, high bounce rates (users leaving your site quickly) and low dwell times (users spending very little time on your site) can indirectly signal to search engines that your website isn’t providing a good experience. A slow website is a primary culprit for both of these negative signals, further affecting your SEO performance.
Conversion Rates and Revenue Growth
Ultimately, the goal of most businesses is to drive conversions – whether it’s a sale, a lead form submission, a download, or a subscription. Website performance has a direct, measurable impact on your bottom line.
Cart Abandonment and Lead Generation
Imagine a customer filling their shopping cart, only for the checkout page to load slowly or glitch. The likelihood of them abandoning that cart skyrockets. Similarly, if your lead generation form takes too long to load or submit, potential leads might simply give up. Every lost conversion is a direct hit to your revenue. Optimizing performance at every stage of the conversion funnel is non-negotiable.
Brand Reputation and Trust
A consistently fast, reliable website builds trust and reinforces your brand’s professionalism. Conversely, a slow, buggy site erodes trust, making your business appear unprofessional, unreliable, and even untrustworthy. In an age where online reviews and recommendations are paramount, a poor website experience can quickly lead to negative sentiment, damaging your reputation and scaring away future customers. Your website is often a direct reflection of the quality and reliability of your products or services.
Competitive Advantage
In many industries, the difference between success and stagnation can come down to marginal gains. A website that consistently outperforms competitors in terms of speed and reliability gives you a significant edge. When customers have multiple options, they will inevitably gravitate towards the one that offers the most seamless and satisfactory online experience. This competitive advantage is often a silent but powerful differentiator.
To effectively monitor website performance for business success, it’s essential to understand the underlying technology that can impact speed and efficiency. A related article that delves into this topic is “NVMe vs SSD: Speed Difference for Dynamic Websites,” which explores the differences between these two storage technologies and how they can affect your website’s performance. You can read the article here: NVMe vs SSD: Speed Difference for Dynamic Websites. Understanding these differences can help you make informed decisions about your website’s infrastructure and ultimately enhance user experience.
Key Metrics to Monitor for Optimal Performance
Now that you understand the immense impact of website performance, let’s explore specifically what you should be monitoring. Think of these as the vital signs of your website’s health.
Speed and Load Times
These are arguably the most critical and often the most visible performance indicators.
First Contentful Paint (FCP)
FCP measures the time it takes for your browser to render the first bit of content from the DOM. This is when users first perceive anything happening on the screen – even if it’s just a background color or a heading. A low FCP is essential for creating a good initial impression and reducing perceived load time.
Largest Contentful Paint (LCP)
LCP measures the time it takes for the largest content element (an image, video, or large text block) in the viewport to become visible. This is a crucial metric as it often represents the main content of your page and indicates when your site is primarily useful to the user. Google considers a good LCP to be under 2.5 seconds.
Time to Interactive (TTI)
TTI measures the time it takes for a page to become fully interactive, meaning JavaScript has finished loading and the main thread is available to respond to user input reliably. A low TTI ensures that users can immediately engage with your site without frustrating delays after the content has visually loaded.
Total Blocking Time (TBT)
TBT measures the total amount of time that a page is blocked from responding to user input during the loading process. This directly impacts the First Input Delay (FID) and indicates how unresponsive your page might be before it’s fully interactive. High TBT can lead to significant user frustration.
Speed Index
Speed Index measures how quickly the content of a page is visually displayed during page load. It’s an aggregate score that represents the average time it takes for visible parts of the page to be displayed. A lower Speed Index means a faster visual experience for your users.
Availability and Uptime
Your website can be the fastest in the world, but if it’s down, it’s useless.
Server Response Time
This measures how long your server takes to respond to a request. High server response times can be indicative of underlying server issues, inefficient database queries, or general server overload. Optimizing this is fundamental to overall speed.
Uptime Percentage
This is the percentage of time your website is accessible and operational to users. Aim for 99.9% uptime or higher. Any downtime is lost business, lost leads, and damaged reputation. Regular monitoring helps you identify and rectify outages quickly.
Error Rates (e.g., 4xx, 5xx)
Monitoring for 4xx errors (client errors like 404 Not Found) and 5xx errors (server errors like 500 Internal Server Error) is vital. A sudden spike in these errors can indicate broken links, misconfigured redirects, or severe server problems that are preventing users from accessing your content.
Interaction and Responsiveness Metrics
How well does your site react to user input?
First Input Delay (FID)
FID measures the time from when a user first interacts with a page (e.g., clicks a button, taps a link) to the time when the browser is actually able to begin processing event handlers in response to that interaction. A low FID (ideally under 100ms) is crucial for a smooth and responsive user experience, particularly on interactive pages.
Cumulative Layout Shift (CLS)
CLS measures the unexpected shifting of visual elements within the viewport. Imagine trying to click a button, only for a banner to suddenly load and push the button out of the way. This creates a frustrating and disorienting experience. A low CLS indicates a stable visual experience.
Tools and Strategies for Effective Monitoring
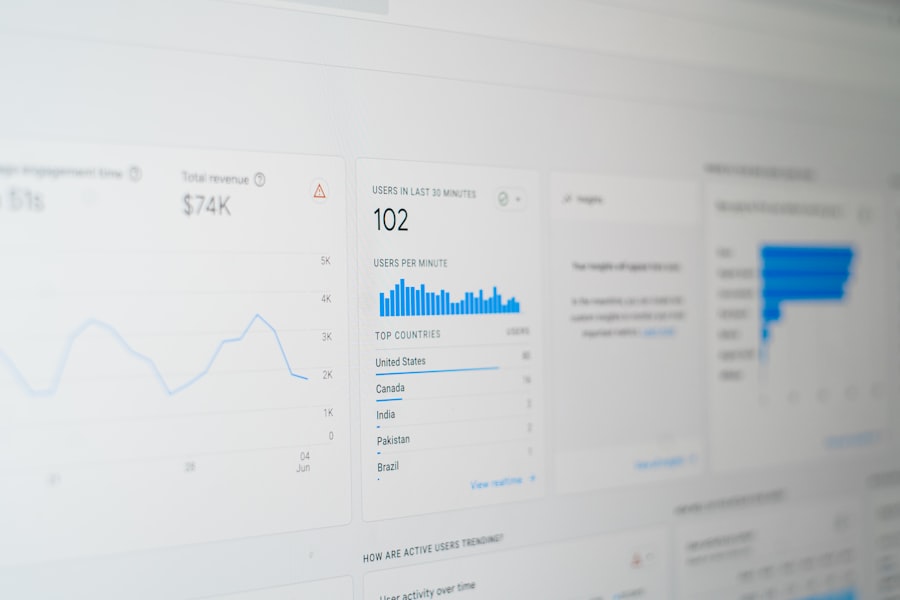
Armed with knowledge of key metrics, your next step is to implement effective monitoring. You don’t need to be a technical expert to get started, as many tools simplify this process.
Synthetic Monitoring (Uptime Monitoring)
Synthetic monitoring involves simulating user interactions with your website from various locations around the globe.
Regular Uptime Checks
These tools periodically “ping” your website from multiple locations to ensure it’s up and running. If your site goes down, you’re immediately alerted via email, SMS, or other channels. Services like UptimeRobot, Pingdom, and Statuscake are popular choices for this. This proactive monitoring allows you to address outages swiftly, minimizing their impact.
Performance Benchmarking
Synthetic monitoring can also track specific page load times, response times, and other performance metrics over time and compare them against benchmarks or competitors. This helps you identify trends, pinpoint performance degradation, and validate the impact of optimization efforts. You can simulate different connection speeds, device types, and geographical locations to get a comprehensive view.
Transaction Monitoring
For critical user journeys (e.g., login, checkout, form submission), transaction monitoring simulates a complete multi-step process. If any step fails or slows down, you’re alerted. This ensures the most important functionalities of your website are always working as intended and provides insight into conversion funnel bottlenecks.
Real User Monitoring (RUM)
While synthetic monitoring gives you a controlled view, RUM captures data directly from actual website visitors.
Page Load Times for Real Users
RUM gathers data on how quickly your pages load for your actual users across different browsers, devices, locations, and network conditions. This provides invaluable insights into the real-world experience, often highlighting issues that synthetic tests might miss. For example, a synthetic test might show great performance, but RUM could reveal that users in a specific region or on a particular mobile network are experiencing much slower speeds.
Identifying Performance Bottlenecks by Segment
RUM allows you to segment performance data by user characteristics. You can see how performance differs for mobile vs. desktop users, new vs. returning visitors, or users from different geographic locations. This helps you prioritize optimization efforts where they will have the greatest impact on your core audience.
JavaScript Error Tracking
RUM tools often include functionality to track JavaScript errors occurring in users’ browsers. These client-side errors can severely impact user experience and site functionality without necessarily causing a full server outage. Catching and fixing these errors quickly is crucial for maintaining a healthy and usable website.
Server-Side and Application Performance Monitoring (APM)
Beyond the front-end, the back-end infrastructure is critical.
Database Query Optimization
Slow database queries are a common culprit for sluggish website performance. APM tools can identify inefficient queries, slow database connections, and other database-related bottlenecks that directly impact server response times. Optimizing these queries can lead to significant performance gains.
API and Microservice Performance
If your website relies on external APIs or a microservices architecture, monitoring their performance is essential. APM tools can track the latency and error rates of these interconnections, ensuring that dependencies aren’t causing your website to slow down or fail.
Resource Utilization (CPU, Memory, Disk I/O)
Monitoring your server’s CPU usage, memory consumption, and disk input/output can reveal overloaded servers, memory leaks, or inefficient resource allocation. Addressing these issues can prevent bottlenecks and ensure your server can handle traffic spikes.
Implementing a Proactive Optimization Strategy
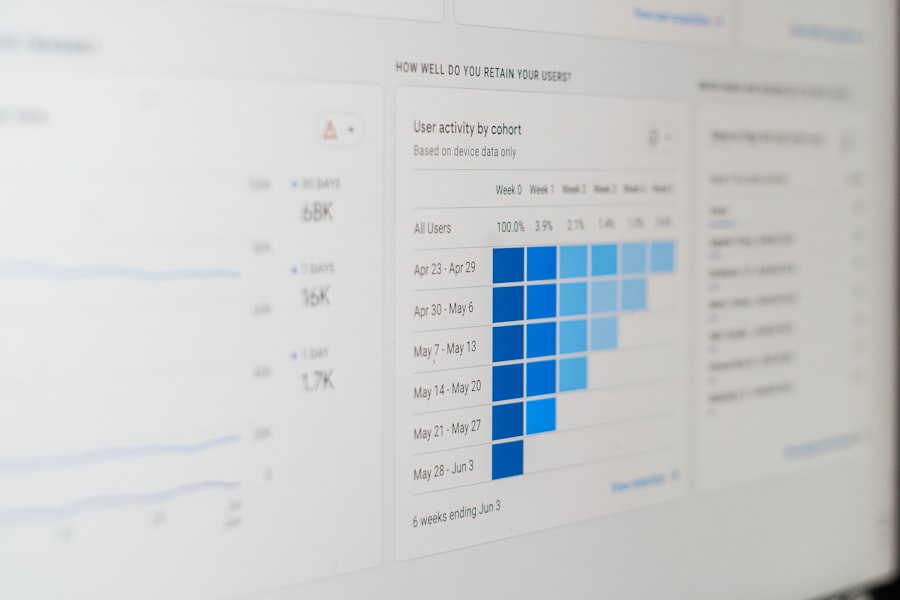
Monitoring is only half the battle; the insights gained must fuel a continuous cycle of optimization.
Regular Auditing and Benchmarking
Don’t treat performance optimization as a one-time task. Your website content changes, traffic patterns evolve, and web technologies advance.
Scheduled Performance Scans
Regularly run performance audits using tools like Google PageSpeed Insights, GTmetrix, or WebPageTest. These tools provide detailed reports and actionable recommendations. Integrate these scans into your routine development and maintenance cycles.
Competitor Analysis
Benchmark your website’s performance against your direct competitors. Are they consistently faster in certain areas? Understanding where you stand relative to others can highlight areas for improvement and opportunities to gain a competitive edge.
Baseline Establishment
Establish clear performance baselines for your key metrics. When you make changes to your website, you can then compare new performance data against these baselines to accurately assess the impact of your optimizations. This data-driven approach ensures you’re making improvements rather than inadvertently causing regressions.
Addressing Common Performance Bottlenecks
Many performance issues stem from well-known culprits.
Image Optimization
Large, unoptimized images are one of the most common causes of slow page loads. Compress images, use modern formats like WebP, and implement responsive images (serving different image sizes based on device). Lazy loading images (loading them only when they are about to enter the viewport) is also a highly effective strategy.
Minification and Compression
Minify HTML, CSS, and JavaScript files to remove unnecessary characters (whitespace, comments) without changing functionality. Enable GZIP or Brotli compression on your server to reduce the size of files transferred to the browser, significantly speeding up load times.
Caching Strategies
Leverage browser caching, server-side caching, and Content Delivery Networks (CDNs). Caching stores copies of your website’s assets closer to users, reducing server load and dramatically speeding up content delivery for repeat visitors. CDNs are particularly effective for geographically dispersed audiences.
Reducing Render-Blocking Resources
Identify and eliminate render-blocking JavaScript and CSS. These resources prevent the browser from rendering the page until they are loaded and parsed. Deferring non-critical JavaScript and asynchronously loading CSS can significantly improve FCP and LCP.
Server and Hosting Upgrades
Sometimes, your website performance issues aren’t due to your code but your hosting environment. Consider upgrading your hosting plan, moving to a dedicated server, or utilizing a cloud hosting provider if your performance metrics consistently point to server-side limitations. A powerful and well-configured server is the foundation of a fast website.
To ensure your website is performing optimally, it’s essential to stay informed about the latest strategies and metrics that can enhance user experience and boost business success. A valuable resource on this topic is an article that delves into mastering Core Web Vitals, which are crucial for improving your site’s speed and responsiveness. You can read more about it in this insightful piece on accelerating your WordPress site. By implementing the techniques discussed, you can significantly enhance your website’s performance and ultimately drive better results for your business.
Integrating Performance Monitoring into Your Business Operations
| Metrics | Description |
|---|---|
| Page Load Time | The time it takes for a web page to load completely |
| Page Views | The number of times a page has been viewed by visitors |
| Bounce Rate | The percentage of visitors who navigate away from the site after viewing only one page |
| Conversion Rate | The percentage of visitors who take a desired action, such as making a purchase or filling out a form |
| Website Traffic | The total number of visitors to the website |
To truly maximize business success, performance monitoring shouldn’t be an afterthought; it needs to be deeply integrated into your workflow.
Setting Up Alerts and Notifications
Don’t wait for customers to tell you your website is slow or down. Implement proactive alert systems.
Threshold-Based Alerts
Configure your monitoring tools to send alerts when specific metrics cross predefined thresholds. For example, if your LCP exceeds 3 seconds, or your uptime drops below 99.9%, you should be notified immediately. This allows for rapid response to critical issues.
Multi-Channel Notifications
Ensure alerts reach the right people through appropriate channels – email for less urgent issues, SMS or Slack/Teams notifications for critical outages. Having multiple notification strategies ensures that alerts are seen and acted upon, regardless of individual availability.
Incident Response Playbooks
For critical alerts, have clear incident response playbooks in place. Who is responsible for what when your website goes down? What are the immediate troubleshooting steps? Documenting these procedures ensures a swift and organized response, minimizing downtime and its impact on your business.
Regular Reporting and Analysis
Turn raw data into actionable insights for continuous improvement.
Performance Dashboards
Create easily digestible dashboards that display key performance metrics over time. These dashboards should be accessible to relevant stakeholders, allowing everyone to understand the current state of your website’s health at a glance. Visual representations are often more impactful than raw data.
Trend Analysis and Predictive Modeling
Regularly analyze performance trends. Are certain pages consistently slowing down? Are you seeing performance dips during peak traffic hours? By identifying patterns, you can proactively address potential issues before they become critical, and even forecast future resource needs.
Post-Mortem Analysis
After an outage or significant performance degradation, conduct a thorough post-mortem analysis. What caused the issue? How quickly was it resolved? What steps can be taken to prevent recurrence? This continuous learning process is vital for building a resilient and high-performing website.
Fostering a Performance-Aware Culture
Ultimately, maximizing business success through website performance requires a collective effort.
Educate Your Team
Ensure everyone involved in your website – developers, marketers, content creators, and even customer support – understands the importance of performance. Teach them how their actions (e.g., uploading large images, implementing heavy scripts) can impact the user experience.
Integrate into Development Lifecycle
Make performance testing an integral part of your development lifecycle. Don’t wait until launch to discover performance issues. Incorporate performance monitoring into your CI/CD pipelines to catch regressions early and ensure consistent quality.
Prioritize Performance in Decision Making
When making decisions about new features, third-party integrations, or design changes, always consider their potential impact on performance. Sometimes, a slightly less feature-rich or visually complex solution that performs significantly better will yield greater business success in the long run.
By embracing a comprehensive approach to website performance monitoring and optimization, you’re not just chasing arbitrary numbers; you’re directly investing in a superior user experience, enhanced visibility, higher conversion rates, and a stronger, more trusted brand. In the unforgiving digital landscape, being fast and reliable isn’t a luxury – it’s your competitive edge. Start monitoring, start optimizing, and watch your business thrive.
FAQs
What is website performance monitoring?
Website performance monitoring is the process of tracking and analyzing the speed, availability, and overall functionality of a website. It involves using various tools and techniques to measure and assess the performance of a website in order to identify and address any issues that may impact user experience.
Why is website performance monitoring important for business success?
Website performance monitoring is important for business success because it directly impacts user experience, customer satisfaction, and ultimately, the success of the business. A slow or unreliable website can lead to decreased traffic, lower conversion rates, and a negative impact on brand reputation.
What are the key metrics to monitor for website performance?
Key metrics to monitor for website performance include page load time, server response time, uptime/downtime, page size, and overall website speed. These metrics provide insights into the user experience and can help identify areas for improvement.
How can businesses monitor website performance?
Businesses can monitor website performance using a variety of tools and techniques, such as website monitoring services, performance testing tools, and analytics platforms. These tools can track and analyze key metrics, provide real-time alerts for issues, and offer insights into user behavior.
What are the benefits of proactive website performance monitoring?
Proactive website performance monitoring allows businesses to identify and address potential issues before they impact users. This can lead to improved user experience, higher customer satisfaction, increased website traffic, and ultimately, better business outcomes.









Add comment