
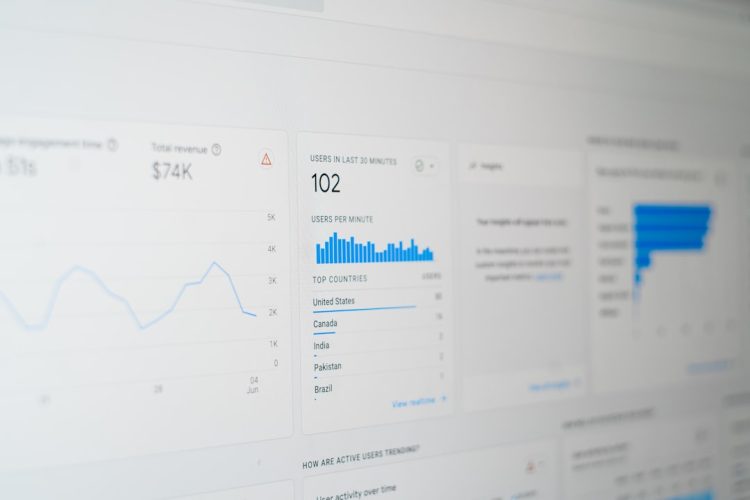
You’ve put your heart and soul into your business, and your website is often the digital storefront, the first impression for potential customers, and the engine driving your online presence. But merely existing online isn’t enough; your website needs to perform. In today’s fast-paced digital world, user expectations are higher than ever. A slow or clunky website isn’t just an inconvenience; it’s a barrier to conversion, a reputational risk, and a missed opportunity. Understanding and actively monitoring your website’s performance isn’t a technical chore; it’s a fundamental business strategy.
Imagine walking into a physical store that’s disorganized, dimly lit, and where staff ignore you. You’d likely turn around and leave. Your website is no different. If it loads slowly, is difficult to navigate, or glitches frequently, visitors will bounce, taking their custom and potential revenue with them. Conversely, a fast, fluid, and responsive website creates a positive user experience, fostering trust, encouraging engagement, and ultimately driving your business goals.
Beyond user satisfaction, website performance significantly impacts your search engine rankings. Search engines like Google prioritize fast-loading, mobile-friendly websites, rewarding them with higher visibility. This means that a well-performing site isn’t just pleasing your customers; it’s also making it easier for new customers to find you in the first place. Neglecting performance is akin to advertising in a bustling marketplace but then hiding your shop behind a slow-moving queue.
This article will equip you, the business owner, with the essential knowledge to understand, monitor, and improve your website’s performance. You don’t need to be a developer to grasp these concepts; you just need to understand their impact on your bottom line. We’ll demystify key metrics, explain their significance, and provide practical insights to help you ensure your digital storefront is always open, inviting, and running at peak efficiency.
Understanding the User Experience: Speed and Responsiveness
When someone visits your website, their immediate experience is heavily dictated by how quickly and smoothly your pages load and respond. This isn’t just about patience; it’s about perceived reliability and professionalism. A slow site can feel outdated, untrustworthy, or even broken.
Page Load Time: The First Impression Metric
This is perhaps the most fundamental performance metric, representing the total time it takes for a page to fully display all its content – images, text, scripts, and stylesheets – in a user’s browser. While there’s no single “perfect” load time, industry benchmarks suggest you should aim for two seconds or less. Every additional second beyond this dramatically increases the likelihood of a visitor abandoning your site.
Why Page Load Time is Crucial for You
- Conversion Rates: Studies consistently show a direct correlation between faster load times and higher conversion rates. For every second your site takes longer to load, your conversion rate can drop by 7% or more. This means fewer sales, fewer sign-ups, and fewer leads.
- User Satisfaction and Brand Perception: A fast-loading site creates a seamless and professional experience, enhancing your brand’s image. A slow site, conversely, can lead to frustration, perceived unreliability, and a negative association with your brand.
- Competitive Advantage: In a crowded market, a faster website can give you a significant edge over competitors who neglect their performance.
Time to First Byte (TTFB): Server Responsiveness
TTFB measures the time it takes for your browser to receive the first byte of information from your server after a request is made. Think of it as the server’s “wake-up call” time. While not a direct measure of what the user sees, a high TTFB indicates fundamental issues with your server setup, hosting provider, or backend processes.
Impact of TTFB on Your Website
- Foundation for Speed: A long TTFB delays the entire loading process. If your server is slow to respond, everything else that follows, from rendering content to executing scripts, will be delayed as well.
- SEO Implications: Search engines factor server responsiveness into their ranking algorithms. A consistently high TTFB can negatively impact your SEO.
- Identifying Server Issues: Monitoring TTFB can help you identify if your hosting plan is inadequate, if your server is overloaded, or if there are inefficiencies in your backend code.
First Contentful Paint (FCP) and Largest Contentful Paint (LCP): What Users See First
These metrics are part of Google’s Core Web Vitals, a set of user-centric performance metrics.
- First Contentful Paint (FCP): Measures the time from when the page starts loading to when any part of the page’s content is rendered on the screen. This is crucial because it tells you when the user perceives that something is happening and the page is loading. Aim for FCP to be under 1.8 seconds.
- Largest Contentful Paint (LCP): Measures the render time of the largest image or text block visible within the viewport. This is often the main hero image or a prominent heading. A good LCP score is under 2.5 seconds. LCP is a critical indicator of perceived page load speed, as it reflects when the most substantial content on your page becomes visible.
Why FCP and LCP are Vital to Your Business
- Perceived Performance: These metrics directly relate to the user’s perception of speed. A fast FCP makes the user feel like the page is loading quickly, even if the entire page isn’t fully interactive yet. A good LCP ensures they see the primary content without a frustrating wait.
- Bounce Rate Reduction: If users see content quickly, they are more likely to stay on the page rather than bouncing back to search results or a competitor’s site.
- Core Web Vitals and SEO: LCP is a prime component of Google’s Core Web Vitals, which is a significant ranking factor. Optimizing for LCP directly contributes to better SEO.
For website owners looking to enhance their site’s efficiency, understanding performance metrics is crucial. A related article that delves deeper into optimizing website speed and user experience can be found at Hostings House Blog. This resource provides valuable insights and actionable tips that complement the key performance metrics every owner should track, ensuring a well-rounded approach to website management.
User Interaction Metrics: Engagement and Usability
Beyond how quickly your site loads, it’s also critical to understand how users interact with it once it’s visible. These metrics shed light on the fluidity and responsiveness of your website to user input.
Total Blocking Time (TBT): Responsiveness to Input
TBT measures the total amount of time during which the main thread of the browser was blocked, preventing the page from responding to user input (like clicks or scrolls). This happens when scripts are loading or executing for too long, essentially freezing the page. A high TBT leads to a frustrating, laggy experience where users click and nothing happens immediately. Aim for TBT to be under 200 milliseconds.
How TBT Impacts Your Users and Business
- Frustration and Abandonment: Imagine trying to click a button or fill out a form, and nothing happens. This leads to immediate frustration and a high likelihood of users leaving your site.
- Perceived Glitchiness: A high TBT makes your site feel unresponsive and broken, eroding user trust and potentially damaging your brand image.
- Conversion Killer: If users can’t interact smoothly with your forms, buttons, or navigation, it directly impacts your ability to generate leads or sales.
Cumulative Layout Shift (CLS): Visual Stability
CLS measures the unexpected layout shifts of visual page content. This occurs when elements on a page move around after they’ve initially loaded, often due to images or ads loading late and pushing other content down. Think of it as text suddenly jumping around as you’re trying to read it. A good CLS score is 0.1 or less.
The Business Implication of CLS
- Annoyance and Disorientation: Layout shifts are incredibly disruptive and annoying for users. They can cause users to accidentally click on the wrong element or lose their place while reading.
- Loss of Trust: A “jumpy” website can feel unprofessional and untrustworthy, especially if important calls-to-action move around.
- Core Web Vitals and SEO: CLS is another crucial component of Google’s Core Web Vitals. Improving CLS positively impacts your search engine rankings and overall user experience.
Technical Efficiency: The Engine Under the Hood
While the previous metrics focus on user perception, these dive into the technical efficiency of your website’s coding and resource management. A lean, optimized backend means a faster, smoother frontend.
Asset Size and Count: The Weight of Your Website
This refers to the total size of all the files (images, videos, scripts, stylesheets, fonts) that your browser needs to download to display a page, as well as the number of individual requests it needs to make. Larger file sizes and excessive requests directly translate to longer load times.
Why Asset Optimization is Critical for Your Business
- Direct Impact on Load Time: This is the most straightforward relationship. More data to download means longer waits for your users.
- Bandwidth Costs: While less common for small businesses, extremely large sites can incur higher bandwidth costs from hosting providers.
- Mobile User Experience: Mobile users often have slower data connections or are conscious of data usage. Large file sizes can quickly eat into their data plans, leading to frustration.
How to Improve Asset Optimization
- Image Compression: Use modern image formats (like WebP) and ensure all images are compressed without losing quality.
- Lazy Loading: Implement lazy loading for images and videos, so they only load when they enter the user’s viewport.
- Minification of CSS/JS: Remove unnecessary characters (whitespace, comments) from your CSS and JavaScript files to reduce their size.
- Consolidate Requests: Combine multiple small CSS or JavaScript files into fewer, larger ones to reduce the number of HTTP requests.
Server Response Time (Not just TTFB): The Full Backend Picture
While TTFB gives a strong initial indicator, server response time broadly refers to how quickly your server processes requests and returns data. This encompasses the time taken to execute database queries, process dynamic content (like e-commerce cart updates), and generate the HTML.
Why Server Performance Matters Beyond Initial Load
- Dynamic Content Efficiency: For interactive websites (e-commerce, user accounts, search functions), slow server response hinders the real-time experience, making actions feel sluggish.
- Scalability: A poorly optimized server can easily be overwhelmed by increased traffic, leading to crashes or excruciatingly slow performance when your business grows.
- Resource Utilization: Efficient server response means your hosting resources are being used effectively, potentially saving you money or allowing you to handle more traffic on the same plan.
Keys to Better Server Response
- Choose a Reputable Hosting Provider: Invest in quality hosting that offers robust infrastructure and good support.
- Optimize Database Queries: For dynamic sites, ensure your database interactions are efficient.
- Server-Side Caching: Implement caching mechanisms to store frequently accessed data and reduce the need for repeat calculations.
- Content Delivery Networks (CDNs): CDNs geographically distribute your website’s static content (images, JS, CSS) to servers closer to your users, significantly reducing latency and speeding up delivery.
Accessibility and Mobile Readiness: Reaching Every Customer
In today’s diverse digital landscape, your website must be accessible to everyone, regardless of their device or ability. Neglecting these areas means alienating potential customers and weakening your overall digital presence.
Mobile Responsiveness: The Non-Negotiable Standard
This metric assesses how well your website adapts and performs on various mobile devices (smartphones, tablets) with different screen sizes and orientations. A truly responsive site provides an optimal viewing and interaction experience across all devices.
The Essential Role of Mobile Responsiveness
- Dominant Traffic Source: A significant and growing percentage of website traffic comes from mobile devices. If your site isn’t mobile-friendly, you’re missing out on a massive audience.
- User Experience (UX): A clunky, non-responsive mobile site leads to frustration, high bounce rates, and a negative perception of your brand. Users expect a seamless experience on their phones.
- SEO Ranking Factor: Google explicitly uses mobile-first indexing, meaning its algorithms primarily evaluate your mobile site for ranking purposes. A poor mobile experience will directly hurt your search engine visibility.
- Conversion Rates: Mobile users are increasingly making purchases and completing forms on their devices. A smooth mobile experience is crucial for converting these visitors into customers.
Key Elements of Mobile Responsiveness
- Fluid Grids and Flexible Images: Content should resize and rearrange automatically to fit the screen.
- Touch-Friendly Navigation: Buttons and links should be large enough and spaced appropriately for tapping.
- Fast Load Times on Mobile Networks: Optimize for slower mobile connections.
- Readability: Text should be easily readable without pinching and zooming.
Accessibility Score: Inclusive Design
Accessibility measures how easily people with disabilities can perceive, understand, navigate, and interact with your website. This includes users with visual impairments (e.g., needing screen readers), hearing impairments, cognitive disabilities, or motor skill challenges.
Why Accessibility is Not Optional for Your Business
- Ethical Responsibility: Ensuring your website is accessible is the right thing to do, reflecting a commitment to inclusion and catering to all potential customers.
- Wider Audience Reach: By making your site accessible, you open your business to a broader demographic, including millions of people with disabilities.
- Legal Compliance: Depending on your industry and location, there may be legal requirements (e.g., ADA compliance in the US) for website accessibility. Non-compliance can lead to costly lawsuits.
- SEO Benefits: Many accessibility best practices (e.g., proper heading structure, alt tags for images) overlap with good SEO practices, helping search engines better understand your content.
- Enhanced User Experience for Everyone: Features designed for accessibility, like clear contrast, keyboard navigation, and proper semantic HTML, often improve the experience for all users.
Key Accessibility Elements to Monitor
- Alt Text for Images: Provide descriptive alternative text for all images so screen readers can describe them to visually impaired users.
- Keyboard Navigation: Ensure all interactive elements can be accessed and operated using only a keyboard.
- Color Contrast: Ensure sufficient contrast between text and background colors for readability.
- Semantic HTML: Use appropriate HTML tags (e.g.,
- Form Labels: Ensure all form fields have clear, associated labels.
Understanding website performance metrics is crucial for any business owner looking to enhance their online presence. By tracking these metrics, you can identify areas for improvement and optimize user experience. For those new to the digital landscape, it’s also important to be aware of common pitfalls that can hinder your success. A helpful resource on this topic is an article that discusses blogging mistakes and offers guidance on how to navigate them effectively. This can complement your efforts in monitoring performance metrics and ensure that your website is not only fast but also engaging for visitors.
Diagnostics and Monitoring: Staying Ahead of the Game
Understanding these metrics is only half the battle; the other half is actively monitoring them and taking action when issues arise. Consistent monitoring is akin to regular check-ups for your car – it helps identify small problems before they become major breakdowns.
Error Rates (HTTP Status Codes): Identifying Broken Aspects
This refers to the percentage of requests to your website that result in error codes (e.g., 404 Not Found, 500 Internal Server Error). While occasional errors can happen, a rising trend in error rates indicates significant problems that impact user experience and potentially SEO.
The Business Impact of High Error Rates
- SEO Damage: Search engines penalize sites with a high number of broken links or server errors. This can lead to lower rankings and less organic traffic.
- User Frustration and Lost Trust: Hitting a 404 page repeatedly is highly frustrating. It can make your site seem unprofessional or abandoned, leading users to leave and doubt your reliability.
- Lost Conversions: If critical pages (product pages, checkout, contact forms) are returning errors, you’re directly losing sales and leads.
- Reputational Harm: Persistent errors can quickly spread negative word-of-mouth about your website and brand.
What to Look For and How to Fix It
- 404 Not Found: Pages that no longer exist. Check for broken internal links, incorrect external links, or deleted content. Implement 301 redirects for moved content.
- 500 Internal Server Error: A generic server-side error. Requires investigating server logs or contacting your hosting provider/developer.
- 503 Service Unavailable: The server is temporarily unable to handle the request, often due to maintenance or overload.
Uptime/Availability: Your Website’s Constant Presence
Uptime measures the percentage of time your website is accessible and operational to users. A 99.9% uptime (a common target) means your site is down for less than nine hours per year. Anything less is cause for concern.
The Absolute Necessity of High Uptime
- Revenue Loss: If your website is your primary revenue channel, every minute it’s down is lost income.
- Customer Dissatisfaction: Users expect 24/7 access. Downtime frustrates them and drives them to competitors.
- SEO Penalties: Prolonged or frequent downtime signals to search engines that your site is unreliable, negatively impacting your rankings.
- Brand Reputation: Downtime undermines trust and can severely damage your brand’s credibility.
Ensuring Maximum Uptime
- Reliable Hosting Provider: Partner with a hosting company that guarantees high uptime and has robust infrastructure.
- Monitoring Tools: Use third-party uptime monitoring services that alert you immediately if your site goes down.
- Regular Backups: While not directly affecting uptime, regular backups are crucial for quick recovery if downtime occurs due to a catastrophic event.
- Load Balancing and Redundancy: For larger sites, consider solutions that distribute traffic across multiple servers to prevent single points of failure.
Tools and Resources for Owners
You don’t need to be a coding guru to monitor these essential metrics. Several user-friendly tools are available to help you keep a pulse on your website’s performance.
Google PageSpeed Insights
This free tool from Google analyzes your website’s performance on both desktop and mobile, providing scores for Core Web Vitals (LCP, FID/TBT, CLS) and offering actionable recommendations for improvement. It’s often the first stop for a quick performance audit.
Google Analytics
While primarily focused on traffic and user behavior, Google Analytics also provides valuable insights into site speed. You can find “Site Speed” reports that show average page load times across your site, broken down by browser, country, and page. This helps you identify which specific pages are underperforming.
Google Search Console
This tool is indispensable for SEO, but it also features a “Core Web Vitals” report that highlights pages on your site that might have poor LCP, FID (First Input Delay, which TBT closely approximates), or CLS scores. It helps you prioritize which pages need immediate attention for performance.
Uptime Monitoring Services (e.g., UptimeRobot, Pingdom)
These services continually test your website’s availability and alert you instantly via email, SMS, or Slack if it goes down. Many also offer basic performance monitoring, tracking load times and identifying slowdowns.
By consistently monitoring these essential website performance metrics, you equip yourself with the knowledge to make informed decisions about your online presence. Remember, your website isn’t just a brochure; it’s a dynamic, living entity that requires care and attention. By prioritizing performance, you’re not just optimizing code; you’re optimizing your business for growth, customer satisfaction, and long-term success.
FAQs
What are website performance metrics?
Website performance metrics are measurements that track the performance and effectiveness of a website. These metrics help website owners understand how their site is performing and identify areas for improvement.
Why is it important to track website performance metrics?
Tracking website performance metrics is important because it provides valuable insights into how a website is performing. By monitoring these metrics, website owners can identify issues, optimize performance, and improve the overall user experience.
What are some common website performance metrics to track?
Common website performance metrics include page load time, bounce rate, conversion rate, traffic sources, and user engagement. These metrics provide valuable information about the speed, user experience, and effectiveness of a website.
How can website performance metrics impact business success?
Website performance metrics can impact business success by influencing factors such as user satisfaction, search engine rankings, and conversion rates. By tracking and optimizing these metrics, businesses can improve their online presence and drive better results.
What tools can be used to track website performance metrics?
There are various tools available to track website performance metrics, including Google Analytics, PageSpeed Insights, GTmetrix, and Pingdom. These tools provide valuable data and insights to help website owners monitor and improve their website’s performance.









Add comment