
The Unseen Guardian: Why Server Uptime Matters More Than You Think
As a website owner, you’ve invested time, money, and passion into creating your online presence. Whether it’s an e-commerce store, a personal blog, a corporate site, or a sophisticated web application, its very existence hinges on one fundamental principle: accessibility. If your website isn’t online, it simply doesn’t exist to your users. This isn’t just about inconvenience; it’s about reputation, revenue, and relevance. Imagine a physical store that randomly closes its doors for hours or even days without notice – customers would quickly look elsewhere. The same principle applies, perhaps even more acutely, in the digital realm.
Server uptime monitoring isn’t a luxury; it’s an absolute necessity in today’s interconnected world. It’s the continuous vigilance that ensures your digital storefront remains open for business, 24/7. When your server goes down, your website becomes unreachable, and the consequences can be severe. For an e-commerce site, every minute of downtime translates directly into lost sales and disappointed customers. For a content-rich blog, it means missed advertising revenue and frustrated readers who might not return. For a corporate site, it can damage brand trust and hinder critical business operations. Beyond the immediate financial impact, there’s the erosion of trust. Users expect reliability, and a site that’s frequently unavailable broadcasts a message of unprofessionalism and unreliability. This can be particularly damaging for new businesses trying to establish credibility.
The modern web is highly competitive. If your site isn’t performing, your competitors are just a click away. Users have a low tolerance for slow loading times or inaccessible content. A significant portion of visitors will abandon a page if it doesn’t load within a few seconds, let alone if it’s completely down. This “bounce rate” directly impacts your search engine rankings, as Google and other search engines prioritize sites that offer a good user experience, which inherently includes reliability. Consistent uptime is a powerful signal to search engines that your site is dependable and valuable. Therefore, proactive monitoring isn’t just about reacting to problems; it’s about maintaining a healthy online ecosystem for your business. It allows you to identify and address issues before they escalate, preserving your reputation, securing your revenue streams, and ensuring your hard-earned traffic isn’t wasted on a digital void.
For website owners looking to enhance their online presence, understanding server uptime monitoring is crucial. In addition to monitoring uptime, it’s equally important to prioritize website security to protect against potential threats. A related article that provides valuable insights on this topic is titled “12 Latest Website Security Best Practices in 2023.” You can read it [here](https://blog.hostingshouse.com/12-latest-website-security-best-practices-in-2023/). This resource offers essential tips that complement the knowledge gained from server uptime monitoring, ensuring a comprehensive approach to maintaining a reliable and secure website.
Essential Components of an Effective Uptime Monitoring Strategy
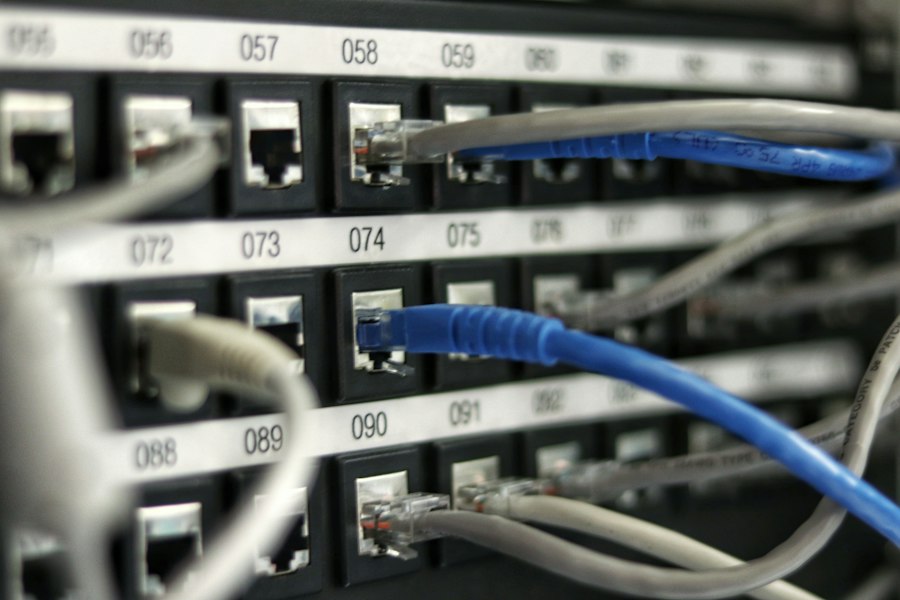
Implementing a robust uptime monitoring strategy involves more than just occasionally checking if your site loads in your browser. It requires a systematic approach, utilizing dedicated tools and understanding what aspects of your server and website need constant vigilance.
Choosing the Right Monitoring Tools
The market offers a plethora of uptime monitoring services, ranging from free basic options to comprehensive enterprise-grade solutions. Your choice should depend on the size and complexity of your website, your budget, and the level of detail you require.
Free vs. Paid Solutions
Free services often provide fundamental checks, such as pinging your server at regular intervals (e.g., every 5-10 minutes) and sending basic email alerts when a downtime is detected. They are suitable for personal blogs or very small sites with limited traffic and non-critical operations. Examples include UptimeRobot (for its free tier) or smaller, open-source scripts. However, they usually lack advanced features like multi-location checks, detailed reporting, or integrations with other services.
Paid solutions, on the other hand, offer a much broader spectrum of features. They typically include more frequent checks (down to every 30 seconds or even less), monitoring from multiple global locations to differentiate between local network issues and actual server outages, and various alert channels (SMS, phone calls, Slack, PagerDuty, etc.). They also often provide sophisticated reporting and analytics, showing uptime history, response time trends, and root cause analysis. Services like Pingdom, StatusCake, UptimeRobot (paid tiers), New Relic, and Datadog fall into this category. For any business-critical website, the investment in a paid monitoring solution is almost always justified by the peace of mind and the ability to minimize costly downtime.
Key Features to Look For
When evaluating monitoring tools, consider these crucial features:
- Monitoring Frequency: How often does the service check your website? More frequent checks mean faster detection of issues.
- Multiple Locations: Does it check your site from different geographic regions? This helps identify regional connectivity problems versus a global outage.
- Protocol Support: Can it monitor HTTP/HTTPS, but also other services like FTP, SMTP, DNS, or custom ports? This is important if your website relies on various underlying services.
- Advanced Checks: Can it perform content checks (e.g., searching for a specific string on your page to ensure it’s not just a blank page or an error message), transaction monitoring (simulating user paths like login or checkout processes), or API monitoring?
- Alerting Mechanisms: What types of alerts does it offer (email, SMS, push notifications, phone calls)? Can you customize alert thresholds and escalation paths?
- Reporting and Analytics: Does it provide clear dashboards, historical data, and performance trends? This helps in understanding patterns and making informed decisions.
- Integrations: Can it integrate with other tools you use, such as Slack, PagerDuty, or incident management systems?
Understanding What to Monitor
Simply checking if your website loads is a good start, but it’s often not enough. A comprehensive strategy involves monitoring several layers of your infrastructure.
Website Availability (HTTP/HTTPS)
This is the most basic and fundamental check. The monitoring service attempts to access your website’s URL (e.g., https://yourwebsite.com) and verifies that it receives a successful HTTP status code (typically 200 OK). If it receives a 4xx (client error) or 5xx (server error) code, or no response at all, it signals a problem. Some services can also check for specific content on the page to ensure the site isn’t serving an error page with a 200 OK status.
Server Resource Utilization
While your website might be “up,” poor server performance can still ruin the user experience. Monitoring CPU usage, RAM consumption, disk I/O, and network bandwidth on your server or hosting environment is crucial. High resource utilization can indicate bottlenecks, inefficient code, or even a denial-of-service (DoS) attack. Tools like New Relic, Datadog, Prometheus, or even simpler top or htop commands combined with alert scripts can help here. Most cloud providers (AWS CloudWatch, Azure Monitor, GCP Stackdriver) also offer comprehensive resource monitoring for their virtual machines and services.
Database Connectivity
Many websites are dynamic, relying heavily on a database to store and retrieve content. If your database server goes down or becomes unresponsive, your website will likely display errors or incomplete information, even if the web server itself is operational. Monitoring database connection health and query performance is vital. This can involve simple ping checks to the database server port or more sophisticated application performance monitoring (APM) tools that track individual query times.
DNS Health
The Domain Name System (DNS) is the internet’s phonebook. If your DNS records are misconfigured or your DNS server is experiencing issues, users won’t be able to find your website, regardless of whether your server is up and running. DNS monitoring checks the availability and correctness of your DNS records.
SSL Certificate Expiration
An expired SSL certificate will trigger security warnings in browsers, deterring users and potentially damaging your site’s search engine ranking. Many monitoring services offer SSL certificate expiration checks, alerting you well in advance so you can renew it without interruption.
Configuring Your Monitoring for Maximum Effectiveness

Once you’ve chosen your tools and identified what to monitor, the next step is to configure your system intelligently to ensure you get timely, actionable alerts without being overwhelmed by false positives.
Setting Up Alerts and Notifications
The core value of uptime monitoring lies in its ability to notify you immediately when something goes wrong. However, poorly configured alerts can lead to “alert fatigue,” where you start ignoring notifications because too many are irrelevant or non-critical.
Defining Critical Thresholds
Don’t just set up alerts for “down.” Consider thresholds for performance degradation. For example, if your website’s response time consistently exceeds 3 seconds, that might warrant an alert, even if it’s still technically “up.” Similarly, set thresholds for server resource utilization. A CPU usage consistently above 80% or memory usage above 90% might indicate an impending problem that needs attention before it causes a full outage. Be realistic about what constitutes a critical issue for your specific website.
Escalation Paths
Who needs to know about an outage, and when? Establish a clear escalation path. For minor issues, an email to your IT team might suffice. For critical 2 AM outages, an SMS or phone call to an on-call person is usually necessary. Most monitoring services allow you to define multiple contacts and escalate alerts if the initial recipient doesn’t acknowledge the issue within a specified timeframe. For instance, after 5 minutes, email Team Lead; after 15 minutes, SMS Senior Admin; after 30 minutes, call CEO.
Avoiding False Positives
False positives are your enemy. They erode trust in your monitoring system. Many tools offer “confirmation checks” – where they re-verify an outage from multiple locations before sending an alert. This is crucial. A single failed check from one location might be a transient network glitch, not a server outage. Require at least two or three failed checks from different geographical regions before triggering a critical alert. Also, be mindful of maintenance windows; temporarily disable alerts for planned maintenance to avoid unnecessary notifications.
Leveraging Multi-Location Checks
As mentioned earlier, monitoring from multiple geographic locations is paramount. If your website is primarily serving users in Europe, but your monitoring service only checks from North America, you might miss a regional connectivity issue or a problem specific to your CDN’s European points of presence. Conversely, if your site is down only for North American users, a multi-location check will quickly pinpoint that specific problem rather than implying a global outage. This also helps distinguish between a true server problem and a localized network issue between your server and a single monitoring node.
Content Matching for Deeper Insight
A “200 OK” status code doesn’t always mean your website is fully functional. Your server could be returning an empty page, an error page with a 200 status, or a completely broken layout. Content matching allows your monitoring tool to look for a specific string of text (e.g., “Welcome to our store,” the copyright notice, or a specific heading) on the loaded page. If that string isn’t found, even with a 200 OK, it indicates a functional problem with your website, not just a server availability issue. This provides a much deeper and more accurate understanding of your site’s health from a user’s perspective.
Reacting to and Learning from Downtime Incidents
Detecting downtime is only half the battle. How you react and what you learn from each incident are equally important for long-term reliability.
Incident Response Plan
Having a pre-defined incident response plan is critical. When an alert comes in, panic is not an option. Everyone involved should know their role and responsibilities.
Who to Notify
Beyond your internal team, consider who else needs to be notified. For significant outages, customers might need updates. This could be via a status page (e.g., Statuspage.io, Atlassian Statuspage), social media, or email. Transparency builds trust, even during problems. Clear communication, even if it’s just “We’re aware of the issue and working on it,” is always better than silence.
Steps for Diagnosis and Resolution
Your plan should outline the steps for diagnosing the problem. This might include checking server logs, restarting services, scaling resources, or contacting your hosting provider. Create checklists for common issues. For example, if database connectivity is lost, the first steps might be to check the database server status, then network connectivity, then application logs. The faster you can diagnose, the faster you can resolve.
Post-Mortem Analysis
Once the incident is resolved, a post-mortem (or post-incident review) is invaluable. This is not about blame; it’s about learning. Analyze:
- What happened? (Timeline of events)
- Why did it happen? (Root cause)
- How long did it last? (Impact)
- What was the resolution?
- What could have prevented it?
- What can we do to prevent recurrence?
Document these findings. Update your monitoring configurations, improve your infrastructure, or refine your incident response plan based on these lessons.
Analyzing Historical Uptime Data
Your monitoring service isn’t just for real-time alerts; it’s also a rich source of historical data. Don’t let this data go to waste.
Identifying Trends and Patterns
Look for patterns in your downtime. Does your site frequently go down during peak traffic hours? Is there a recurring issue after specific software updates? Are certain components (e.g., a specific plugin, a third-party API) consistently failing? Identifying these trends can help you anticipate problems and address underlying weaknesses before they cause major outages. For instance, if you see consistent performance degradation every time your monthly newsletter goes out, it might indicate a need for more robust server resources or better email campaign management.
Performance Benchmarking
Track your website’s average response time over time. Are there slow but steady increases? This could indicate accumulating database bloat, inefficient queries, or growing resource demands that will eventually lead to bigger problems. Compare your performance against industry benchmarks or your competitors (if public data is available). Strive for continuous improvement.
Service Level Agreement (SLA) Compliance
If you have an SLA with your hosting provider or clients, your uptime monitoring data is crucial for verifying compliance. Most paid monitoring services provide detailed reports that can be used as evidence of uptime or downtime, helping you hold providers accountable or demonstrate your reliability to clients. This data is objective and verifiable, making it a valuable asset in business relationships.
For website owners, understanding the importance of server uptime monitoring is crucial for maintaining a reliable online presence. In addition to monitoring uptime, it’s beneficial to explore various tools that can enhance your overall business operations. A related article that delves into essential business tools for solo entrepreneurs can provide valuable insights. You can read more about it in this helpful resource, which outlines a tech stack that can streamline your workflow and improve efficiency.
Proactive Measures and Best Practices
| Metric | Description | Importance for Website Owners | Recommended Monitoring Frequency |
|---|---|---|---|
| Server Uptime Percentage | The amount of time the server is operational and accessible, usually expressed as a percentage over a given period. | Indicates reliability; higher uptime means better availability for visitors. | Continuous (real-time monitoring) |
| Downtime Duration | The total time the server is unavailable or offline during a monitoring period. | Helps assess the impact of outages on user experience and business operations. | Continuous (real-time monitoring) |
| Response Time | Time taken by the server to respond to a request. | Critical for user experience; slow response can lead to visitor loss. | Every few minutes |
| Number of Outages | Count of distinct server downtime events within a period. | Helps identify stability issues and frequency of disruptions. | Daily or weekly |
| Mean Time to Recovery (MTTR) | Average time taken to restore the server after an outage. | Measures efficiency of incident response and recovery processes. | After each outage |
| Server Load | Current processing demand on the server. | High load can lead to slowdowns or crashes; monitoring helps prevent issues. | Continuous or every few minutes |
| Error Rate | Percentage of failed requests or server errors. | Indicates server health and potential problems affecting uptime. | Every few minutes |
While monitoring reacts to issues, a truly resilient website also incorporates proactive strategies to prevent problems from occurring in the first place.
Regular Maintenance and Updates
Keeping your server’s operating system, web server software (Apache, Nginx), database (MySQL, PostgreSQL), and content management system (WordPress, Joomla, custom code) up-to-date is paramount for security and performance. Outdated software often has known vulnerabilities that attackers can exploit, leading to downtime or data breaches. Furthermore, updates often include performance enhancements and bug fixes that contribute to overall stability. Schedule these updates during off-peak hours and always test them in a staging environment before deploying to production.
Optimized Server and Website Performance
A slow website is often a precursor to an unavailable one. Optimizing your website and server can significantly improve stability and reduce the likelihood of resource-related downtime.
Caching Strategies
Implement robust caching at multiple levels: browser caching, server-side caching (e.g., Redis, Memcached), and CDN caching. Caching reduces the load on your server and database by serving pre-generated content, making your site faster and more resilient to traffic spikes.
Database Optimization
Slow database queries can bring your entire site to a crawl. Regularly optimize your database tables, ensure proper indexing, and review slow query logs. Consider database replication or clustering for high-traffic sites.
Image and Asset Optimization
Large, unoptimized images and other media files significantly increase page load times and consume bandwidth. Compress images, use responsive image techniques, and lazy-load non-critical assets to improve performance.
Content Delivery Networks (CDNs)
A CDN distributes your website’s static assets (images, CSS, JavaScript) across a network of global servers. When a user requests your site, these assets are served from the nearest CDN edge location, reducing latency and offloading traffic from your origin server. This improves performance and provides an additional layer of resilience against traffic spikes and DDoS attacks.
Disaster Recovery and Backups
Uptime monitoring alerts you to problems; disaster recovery planning helps you quickly restore service. Regular backups of your website files and database are non-negotiable. Store these backups in multiple, geographically separate locations. Test your restoration process periodically to ensure your backups are valid and that you can actually bring your site back online if disaster strikes. A backup is only good if you can successfully restore from it.
Redundancy and Scalability
For critical websites, building redundancy into your infrastructure can prevent single points of failure. This might include:
- Load Balancers: Distributing traffic across multiple web servers. If one server fails, the others can pick up the slack.
- Database Replication: Having master-slave or multi-master database configurations ensures that if one database server goes down, another can take over.
- Geographic Redundancy: Hosting your website or data in multiple data centers in different regions. If one region experiences a widespread outage, your site can failover to another.
- Auto-scaling: In cloud environments, configure your resources to automatically scale up (add more servers/resources) during traffic spikes and scale down when traffic subsides. This prevents performance degradation and downtime due to unexpected surges in visitors.
By integrating these proactive measures with your robust uptime monitoring strategy, you create a comprehensive defense against the myriad challenges of keeping a website consistently online and performing optimally. Remember, your website is your digital shop window; keeping it open and inviting is paramount to your online success.
FAQs
What is server uptime monitoring?
Server uptime monitoring is the process of regularly checking a website’s server to ensure it is operational and accessible to users. It involves tracking the amount of time a server is up and running without any interruptions.
Why is server uptime monitoring important for website owners?
Server uptime monitoring is crucial for website owners because it helps them ensure that their website is always available to visitors. Downtime can lead to loss of revenue, decreased customer satisfaction, and damage to the website’s reputation.
How does server uptime monitoring work?
Server uptime monitoring works by using monitoring tools or services to periodically send requests to the website’s server. If the server responds, it is considered up; if there is no response, it is considered down. Website owners are then alerted to any downtime so they can take action to resolve the issue.
What are the common causes of server downtime?
Common causes of server downtime include hardware failures, software issues, network problems, cyber attacks, and scheduled maintenance. By monitoring server uptime, website owners can identify and address these issues promptly to minimize downtime.
How can website owners choose the right server uptime monitoring service?
Website owners should consider factors such as monitoring frequency, alerting mechanisms, reporting capabilities, scalability, and cost when choosing a server uptime monitoring service. It is important to select a reliable service that meets the specific needs of the website.








Add comment